An exciting time. Hope we have more this spring.
Powered by ScribeFire.

An exciting time. Hope we have more this spring.
Powered by ScribeFire.
Posted in Macroeconomics
Welcome to my classes in Spring 2008. I look forward to a lively semester, with some fun and some work. My contact info is here if you need to reach me.
You should read the course info and schedule at least on WebCT BEFORE class. If you want to print them, feel free, but I will not be bringing paper copies to class. You can also get them at my website. Make sure to choose Spring.
Bring any questions you have and feel free to ask them. It’s how we learn things. You can also check out this blog, which has a lot of things that interest me and also some relevant to your classes.
I hope you have a great term, and I expect to also. It will be nice to get to know each of you well.
Posted in Macroeconomics, Managerial Econ, Microeconomics
Hi Mr. Hartman,
Can you please demonstrate how chapter twelve (12) homework is done on the blog please? Your assistance will be greatly appreciated.
Thank you.
Natalia
Sure. Here are the questions. And the answers. I put how to do it nearby.
Chapter 12
1. Given the data below on real GDP and potential GDP for the fictitious country “Alpha” determine each of the following:
a. the year-to-year growth rates of GDP
d. the output gap
e. the output gap as a percentage of potential GDP
f. whether the gap is expansionary or recessionary
1990 17,500 17,300
(a) Can’t do: need two successive years.
(d) Y – Y* = 17500 – 17300 = 200: output gap is positive (real above potential), and this is an expansionary gap.
(e) 200/17500 = .01142 ≈ 1.14% is Output gap over real GDP. Question asks for output gap over potential GDP which is 200/17300 = .01156 ≈ 1.16%
1991 18,200 17,800
(a) 18200 – 17500 = 700; 700/17500 = 0.04 = 4%
(d) Y – Y* = 18200 – 17800 = 400: output gap is positive (real above potential), and this is an expansionary gap.
(e) 400/18200 = .02197 ≈ 2.2% is Output gap over real GDP. Question asks for output gap over potential GDP which is 200/17500 = .01142 ≈ 1.14%
1992 18,500 18,300
(a) 18500 – 18200 = 300; 300/18200 = .0164 ≈ 1.6% etc etc.
(d) Y – Y* = 18500 – 18300 = 200 etc. etc.
(e) 200/18500 = .0108 ≈ 1.08% is Output gap over real GDP. Question asks for output gap over potential GDP which is 200/18300 = .0109 ≈ 1.09% etc. etc.
1993 18,200 18,800
1994 18,600 19,300
1995 19,000 19,800
1996 19,400 20,800
1997 19,900 20,900
1998 20,600 21,100
1999 21,600 21,500
_______________________________________
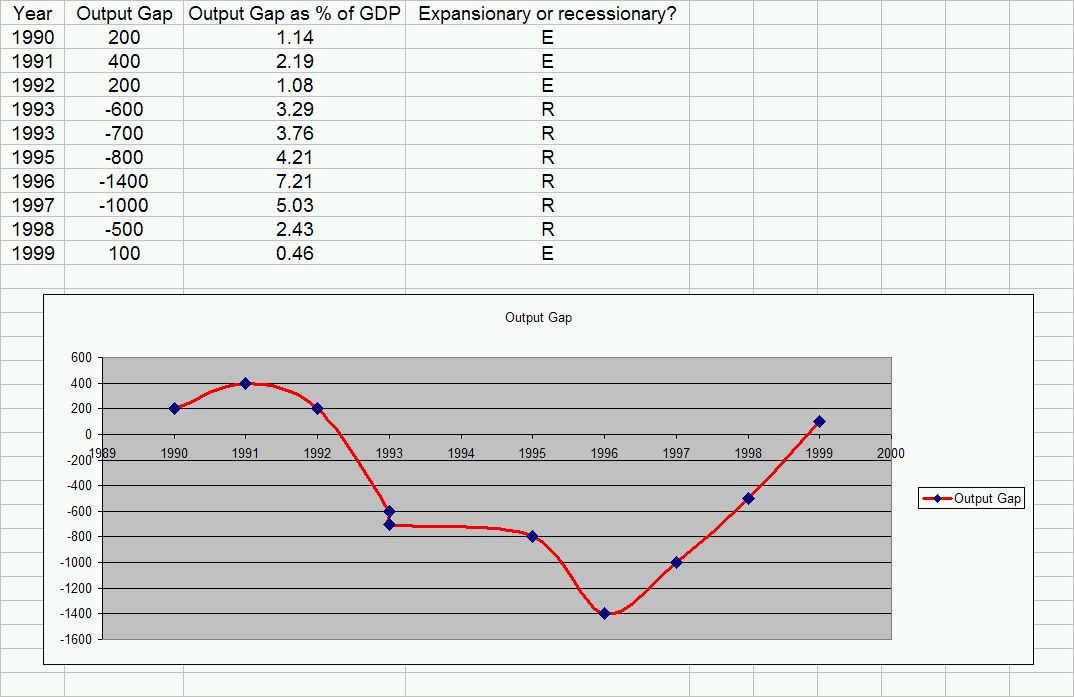
2. Use the data in Problem 1 to graph the economic situation in “Alpha” during the 1990s. Label the phases of the business cycle on your graph.
Graph of output gaps in Alpha’s economy.
3. According to Okun’s Law, if a country’s output gap grows by 4%, its cyclical unemployment rate will grow by how much?
2 percent. Okun’s law says half as much change in unemployment as in output gap. The output gap is considered negative. So a gap growing by 4% means things are getting worse by 4% so that the unemployment must be increasing by 2%.
Answers:
Chapter 12
1a. year-to-year real GDP growth
1991 4.0%
1992 1.6%
1993 -1.6%
1994 2.2%
1995 2.2%
1996 2.1%
1997 2.6%
1998 3.5%
1999 4.9%
b. output gap
1990 200
1991 400
1992 200
1993 -600
1993 -700
1995 -800
1996 -1400
1997 -1000
1998 -500
1999 100
c. output gap as a percent of GDP.
Put gap above in (a) over the real GDP to get these figures. Question asks for Output gap over Potential GDP, so all these are a bit wrong. See above for calculations. Thanks to Natalia Verance for finding this error.
1990 1.14
1991 2.19
1992 1.08
1993 3.29
1994 3.76
1995 4.21
1996 7.21
1997 5.03
1998 2.43
1999 0.46
d. is the gap recessionary or expansionary? Positive numbers above in (a) are expansionary; when Y > Y*.
1990 E
1991 E
1992 E
1993 R
1994 R
1995 R
1996 R
1997 R
1998 R
1999 E
3. 2% Obvious. 2% change in unemployment x 2 = makes 4% change in GDP; but output gap goes up 4% implies unemployment goes down 2%
Posted in Macroeconomics
