This interesting article points out how the nature and availability of insurance can be weaponized in wars such as Trump’s Iran action. If you have not been interested in maritime insurance before, you need to learn how it can work in such a dire situation as the Strait of Hormuz activities now.
It’s a war zone, to be sure. But many ships, shippers, and in fact countries, are dependent on passage. And they need insurance to do it.
Manipulating the insurance ecosystem is a potential way to shape the movement of ships in the Gulf of Hormuz or the Red Sea. It’s been used before, but we are now seeing novel approaches from the US government and from insurers.
Maritime shippers and operators will need to pay attention to this changing landscape.
Coos Bay, OR, USA is pushing for a new West Coast US container port. It will have rail to the port, so that transloading can take place directly to it.
The port planners see a need for another West Coast port of entry for Asian containers that will reach inland via intermodal rail as far as Chicago. The Oregon International Port of Coos Bay has obtained a $25 million grant for pre-planning and pre-construction. The grant will be matched by $25 million from NorthPoint Development, and will be used for environmental review and preliminary engineering activities.
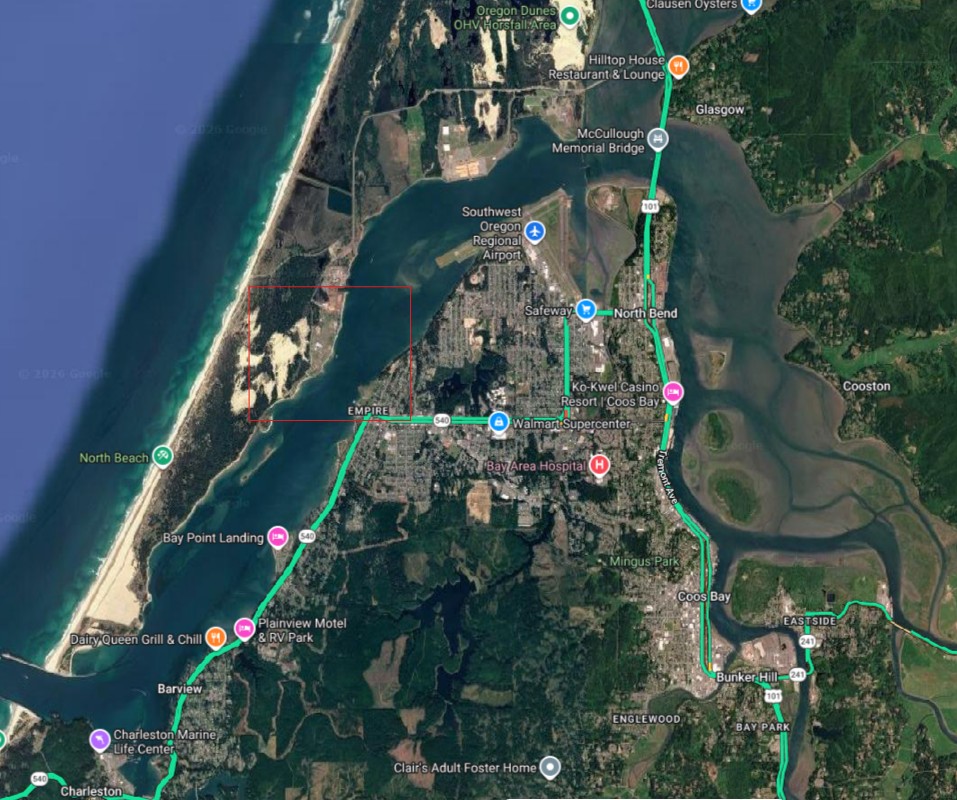
The map below shows why environmental concerns might be considerable. Coos Bay is a small town that’s long been a Mecca for beachgoers and people who love the coastside style of living. A friend moved there from Santa Rosa, in the Bay Area, for that reason.
Google Map of Coos Bay, OR. Red square shows the approximate location of the new container port.
You can see on the map that ingress is through a small strait, with a narrow bay running northward to the Coos River. The port will be on the barrier island, just below another industrial site, a sawmill, according to the planning material. Its projected capacity will be 2 million TEU, or one million forty-foot containers per year.
It’s not a bad idea, geopolitically, to have another West Coast port for containers. It’s a relief valve for the big California ports, which are subject to periodic longshore union strikes and other potential disruptions. Those ports are also major sources of pollution.
The all-rail connection should also make air pollution less of a problem. Perhaps the port can prevent local drayage from causing mammoth traffic and air problems in this pristine area.
Notice Charleston Marine Life Center at the entrance to the strait, a branch of the University of Oregon. Below is a photo of a Dungeness Crab, a local resident; delicious and protected from overfishing. Dredging, which the plan says is necessary, may threaten marine species nearby.
Boxes will move via a short line, Coos Bay Rail Line, owned by the port. It runs north from the peninsula about 137 mi, terminating near Eugene OR at the Union Pacific line. That provides access by rail to all of the central US. And if the UP/NS merger comes to pass, it will provide a single transfer access even to the Northeast US and even Europe. That provides access by rail to all of the central US. And if the UP/NS merger comes to pass, it will provide a single transfer access even to the Northeast US and even Europe.
It’s not clear that more capacity is needed on the West Coast of the US, particularly if interntional maritime trade is resetting and the Asia-US container movements are declining.
Evidently East Coast container traffic is also in decline.
We see a report today of Charleston, on the US East coast, shutting down a 700,000 TEU capacity terminal, Leatherman, because of low demand. It only processed 75,455 containers so far this year. The final capacity of Leathrman Terminal when built out is planned to be 2.4 million TEU. A second berth construction project is being continued. The planned rail yard adjacent to Leatherman, a $690 million project, is being suspended.
Here’s a project that should have happened 20 years ago.
California’s major ports, at Los Angeles and Long Beach, have been desperate for relief from drayage traffic for containers they bring in. It was a struggle to get rail to the ports so that containers could be directly loaded. In 2002 the Alameda Corridor began to move double-stack double-track trains from near (but not on) the ports to the San Bernardino area. But rail service to the bulk of the US was still elusive. Transloading to 53-foot truck containers was the main activity in the Eastern valley. And that led to more truck traffic on the already busy freeways.
Remember that in the earlier days, pre-COVID, the land-bridge was still a preferred route from Asia to Europe. Ship to LA/Long Beach, Rail to New York or another eastern port, and ship again to Europe. It was lower cost and shorter time than any other Asia-North Europe route. And that included the numerous delays in moving goods by rail out of the port areas.
The problem has been urgent because of air pollution from the many drayage trucks traversing the area. California has been trying to address this problem from many directions. One of the first methods was the Clean Trucks program, which banned engines earlier than 2007 carrying to and from ports, and imposed other requirements on NOx and particulate emissions, especially PM2.5, a demonstrated pathogen for breathing problems. Gate reservations came next, as an attempt to articulate delivery and pickup with container movements in the yard.
But many noticed that switching from truck to rail would cut pollution even faster, and perhaps even improve efficiency. Numerous researchers, including my coauthor Chris Clott and me, suggested that moving functions off the port quickly to inland sites, called inland ports, would work. We even suggested, back when the land-bridge was functioning well, that inland ports as far away as Chicago could boost efficiency. The ports were not interested at that time.
Meantime, the ports and private firms have invested in the Alameda Corridor, which took double-stack, double-track trains through a frantically busy melange of LA suburbs, with many overpasses and intersections that had to be rebuilt, and many regulatory challenges.
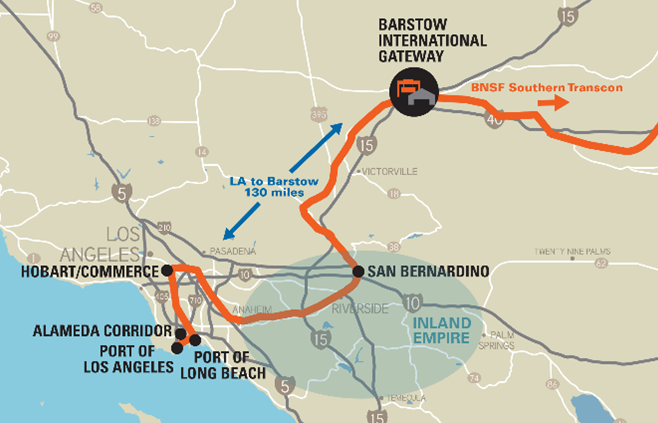
Now finally, BNSF, a major Class I railroad, one of two serving the West Coast, has committed to a large inland rail intermodal terminal. It’s near Barstow, CA, out in the desert, kind of toward Las Vegas. This large inland port will be able to eliminate over 200 million truck miles by its completion in 2028.
The latest yard technology will be used, including zero-emission cranes, forklifts, and hostlers, electric plug-ins for refrigerated containers, and hybrid rubber-tired gantry cranes. BNSF has also committed to use the cleanest available switching locomotives in the yard.
The project is appropriately nicknamed BIG (for Barstow Intermodal Gateway). The press release says “By relocating container sorting and processing from congested port-adjacent communities to Barstow—a high desert hub with strong transportation infrastructure—the project enables a major mode shift from trucking to cleaner, more efficient rail.”
California and its residents are serious about industry controlling pollution.
Christopher Clott, Bruce C. Hartman, Supply chain integration, landside operations and port accessibility in metropolitan Chicago, Journal of Transport Geography, Volume 51, 2016, Pages 130-139, ISSN 0966-6923, https://doi.org/10.1016/j.jtrangeo.2015.12.005.