Tag Archives: environment

Offshore Carbon Capture and Storage

If carbon capture technology is ever to be useful, there have to be places to store the captured carbon. One place is deep in the earth, in abandoned oil wells. We’re seeing somewhat more interest in carbon capture in maritime, and also in manufacturing areas. Maritime is more of an issue, because the captured carbon must be stored onboard, and offloaded periodically.

One option is to sell the compressed cold carbon to industrial users. But there’s not enough demand if most ships were producing captured carbon. Already, onshore carbon capture can supply a good deal of the commercial need for CO2.

Reuse of carbon in this way is simply circular; it does not actually remove carbon from the natural environment, it simply recycles it. And many onshore facilities like power plants and cement processes could rather easily capture their carbon emissions.

All this carbon can’t simply be recycled; there must be a place to put it. It’s odd that there has not been more investment in places to sequester the captured carbon.

That’s why the INEOS announcement in the article below is interesting. INEOS is an international chemical company with headquarters in many countries. (They also co-own and operate Manchester United, a Premier League football club).

They have designed a complete system to sequester the carbon in the North Sea, called Greensand. The full value chain will be established. The captured CO2 will come from Danish biomethane plants.

Once captured, CO2 is liquefied, delivered by truck to a dedicated CO2 terminal at Port Esbjerg, shipped aboard Carbon Destroyer 1, the EU’s first purpose-built CO2 carrier, and injected into the Nini West reservoir in the Danish part of the North Sea, a depleted oil field some 250 km offshore, approximately 1,800 m beneath the seabed.

Currently the project can store 400000 tonnes annually, but plans to expand to between 4 and 8 million tonnes annually.

There are still institutional barriers limiting capture of CO2 at scale — regulations, infrastructure, and investment. Since we’re not going green on energy anytime soon, it’s time to start investing big time in carbon capture — technology and infrastructure.

Logo of Splash247, featuring the word 'Splash' in bold black letters with a blue underline and '247.com' in smaller text.

Bojan Lepic September 18, 2026

https://splash247.com/ineos-opens-eus-first-full-scale-offshore-ccs-project
The Hidden Bill for Climate Inaction: Costs Rising Across U.S. Counties

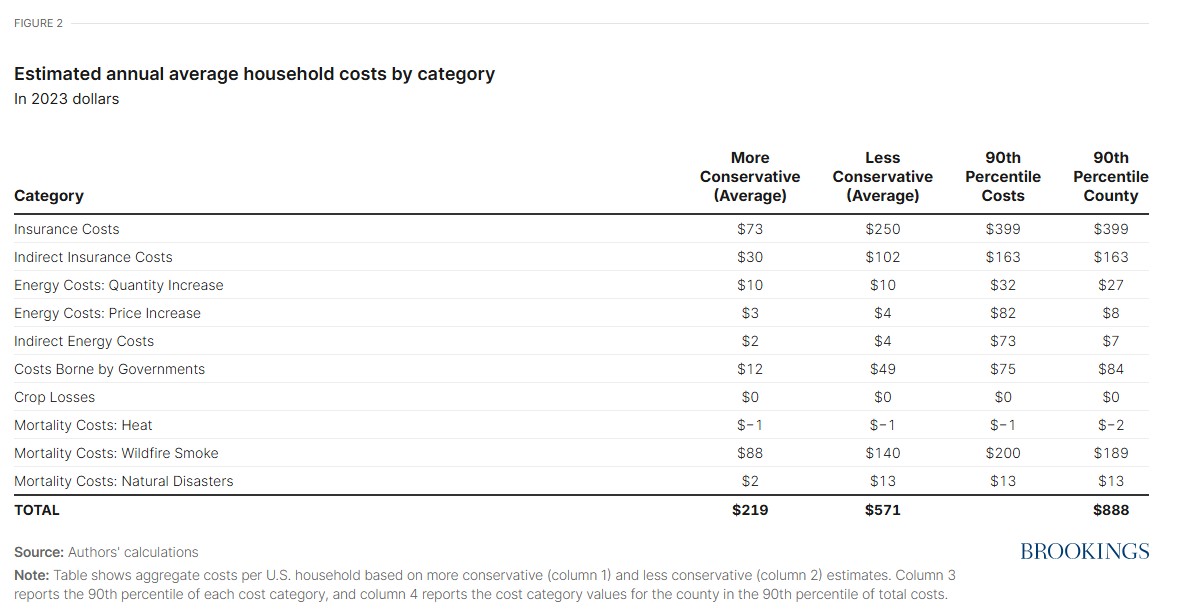
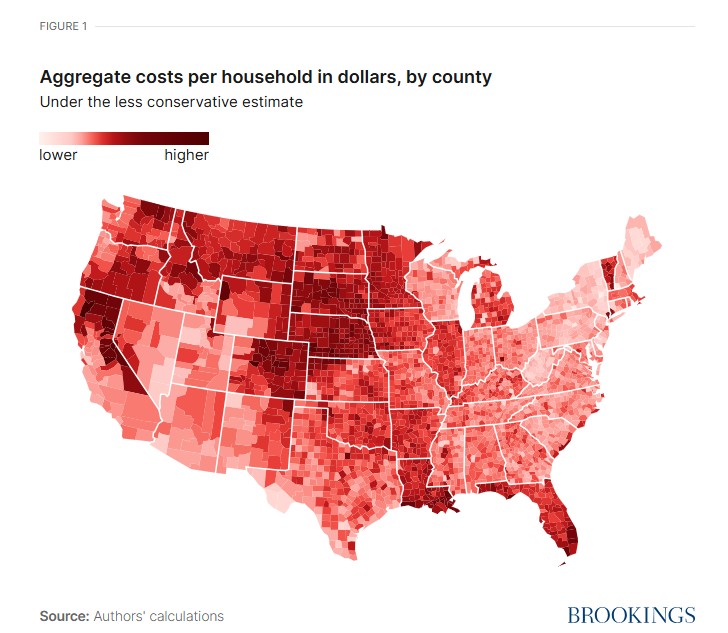
The Fall 2025 edition of Brookings Papers on Economic Activity contains this interesting paper which estimates the annual cost of climate events such as wildfires, air pollution, and warming weather. It’s no secret that climate change affects poorer members of society more. And we could guess that the West Coast, Gulf Coast, and Florida would see the largest effects.

But this analysis by US county really brings home the fact that climate change is costing every ne of us money even today.

One interesting observation is the huge jump in cost for mortality and for insurance. It makes the point that the risks are what is driving the cost. It means we have to think about probabilities and chance effects. Most people aren’t very good at estimating that. Or they can’t appreciate the meaning of a certain low-probability number; they assume it can’t happen to them!

The mortality costs come from the effects of wildfire smoke and from natural disasters. The extra heat alone doesn’t create much cost. The extra deaths from heat are roughly offset by a reduction in deaths from cold weather.

Insurance costs both direct (payouts due to disasters) and indirect (premium boosts or loss of coverage) are a big factor. We might not manage to afford the risk of climate change. This table illuminates the source of the costs.

A final note; local governments are going to increasingly bear the cost of climate events. They will need to invest in protections or raise money to pay for the disasters as they occur. You can bet that will be priced into local bond interest rates and increased local tax rates on property or sales.

The authors don’t claim to have covered all the costs. But the analysis down to the county level brings home to localities and individuals how they are being affected.

The draft paper can be found from a link in the article— it’s posted here.

Kimberly A. Clausing, Christopher R. Knittel, and Catherine Wolfram

September 24, 2025

https://www.brookings.edu/articles/who-bears-the-burden-of-climate-inaction/

The paper summarized here is part of the fall 2025 edition of the Brookings Papers on Economic Activity, the leading conference series and journal in economics for timely, cutting-edge research about real-world policy issues. Research findings are presented in a clear and accessible style to maximize their impact on economic understanding and policymaking. The editors are Brookings Nonresident Senior Fellows Janice Eberly and Jón Steinsson.

LNG bunker supply chain emissions

It’s difficult to quantify the emissions load generated by LNG bunkering for oceangoing ships. Rystad Energy has released a study of this from Well to Tank.

Liquefied Natural Gas (LNG) is currently an important maritime fuel as the industry tries to transition to a lower carbon footprint. LNG-fuelled ships now account for over 20% of the current order book.

The question is this: how does LNG perform in terms of greenhouse emissions? One needs to consider how it’s produced (Well!), transported, liquefied, stored, and processed for bunkering, as well as the loading process. That’s the study’s focus.

They found 13.9 grams of carbon dioxide equivalent per megajoule heating value, known as LHV. This broke down into 4.2 gCO23/MJ, for upsteam; 1.3 for transportation and processing; 5.9 for liquefaction; 1.8 for shipping and distribution; and 0.7 for bunkering operations.

The total of 13.9 compares with the FuelEU Maritime figure of 18.5 gCO2e/MJ, which Rystad says is too high.

A key quote from the article:

Rystad’s Vice President Emissions Research, Patrick King, commented: “Our analysis is based on asset-level data that ties specific gas fields to liquefaction facilities. This approach, supported by satellite-detected methane plume data and reported asset information, gives a more accurate picture of the LNG actually used for bunkering, rather than relying on outdated or overly broad averages.”

It seems like the right way to do the analysis.

The study is available from Rystad Energy or asoffered by Rystad

Seatrade logo

Paul Bartlett, Correspondent

September 4, 2025

https://www.seatrade-maritime.com/lng/rystad-releases-findings-on-lng-bunker-supply-chain-emissions