It’s been a year since the shipping agreement expired between Russia and the UN. The agreement allowed grain from Ukraine to be exported through the Black Sea without attacks from Russia. Many believed that the expiration would mean disaster for Ukranian grain shipments.
Ukraine is one of the world’s greatest exporters of grains. The country has a legendary reputation as the world’s breadbasket. In fact, some underdeveloped countries rely on imported grain, and much of it comes from Ukraine. Developed countries also find it beneficial to use Ukranian grain if they have limited ability to grow it domestically. And Ukraine’s farmers rely on the income from grain sales to keep producing.
We might have expected grain shipments to collapse. But that hasn’t been the case.
In 2024 grain exports by sea actually increased by quite a bit, close to doubling early 2023’s.
The downside of this is the exports are being maintained by a military campaign by Ukraine. It uses drones to keep the Russian navy at bay and prevent their attacks on the grain ships. The ships hug the coastlines of Bulgaria and Romania to escape Russian interdictions. Or they use the Danube River to go inland instead.
It seems wasteful to require military action to keep the grain flowing to the world.
That’s what war does; it makes people waste valuable resources, that could be used to make life better for everyone. The Ukraine war is harming everyone.
We now have the latest State of Logistics Report from Penske and Kearney in cooperation with the Council of Supply Chain Management Professionals (CSCMP). It’s a good piece of solid research. I was most interested in two specific aspects it presents.
The first topic was the total United States Business Logistics Costs (USBLC) table. Logistics costs in 2023 actually shrank by 11% over the past year, 2022. That’s a big drop.
First we should note that Motor Carrier costs dwarf all the others, at $937 billion. That’s because in the US Motor Carrier is by far the largest mode of transport, by just about any measure, roughly an order of magnitude greater than the others. It dropped by around 8% from 2022, not the largest drop, which was Water transport. Rail and Parcel held about even, and pipeline went up.
The second largest category of costs is not even a cost of movement; the financial cost of inventory storage at $302 billion. All the carrying costs dropped around 8% from 2022 to 2023.
The third largest category of costs is Parcel at $215 billion. Parcel is driven by e-commerce movements, both business-to-business and business-to-consumer. Parcel costs were holding steady, not a surprise since they have a big labor component, and wages were rising. We’ve all heard of new labor agreements with UPS and Fedex, raising wages substantially.
We noted a large percentage increase (14%) in Shippers’ administrative costs, the largest increase of any category. With all the talk around AI and using computers to relieve administrative paperwork burdens, we don’t see any efficiency realized in the costs. True, logistics is not considered a pioneer industry in adopting technology. It’s probably because logistics is about coordination and cooperation, the hardest problems for computer technology to crack. To make the gains from technology, you have to capture the people doing the work and convince them that things will be better with the technology, that you can make improvements or savings you couldn’t before. It’s a hard sell in many logistics operations.
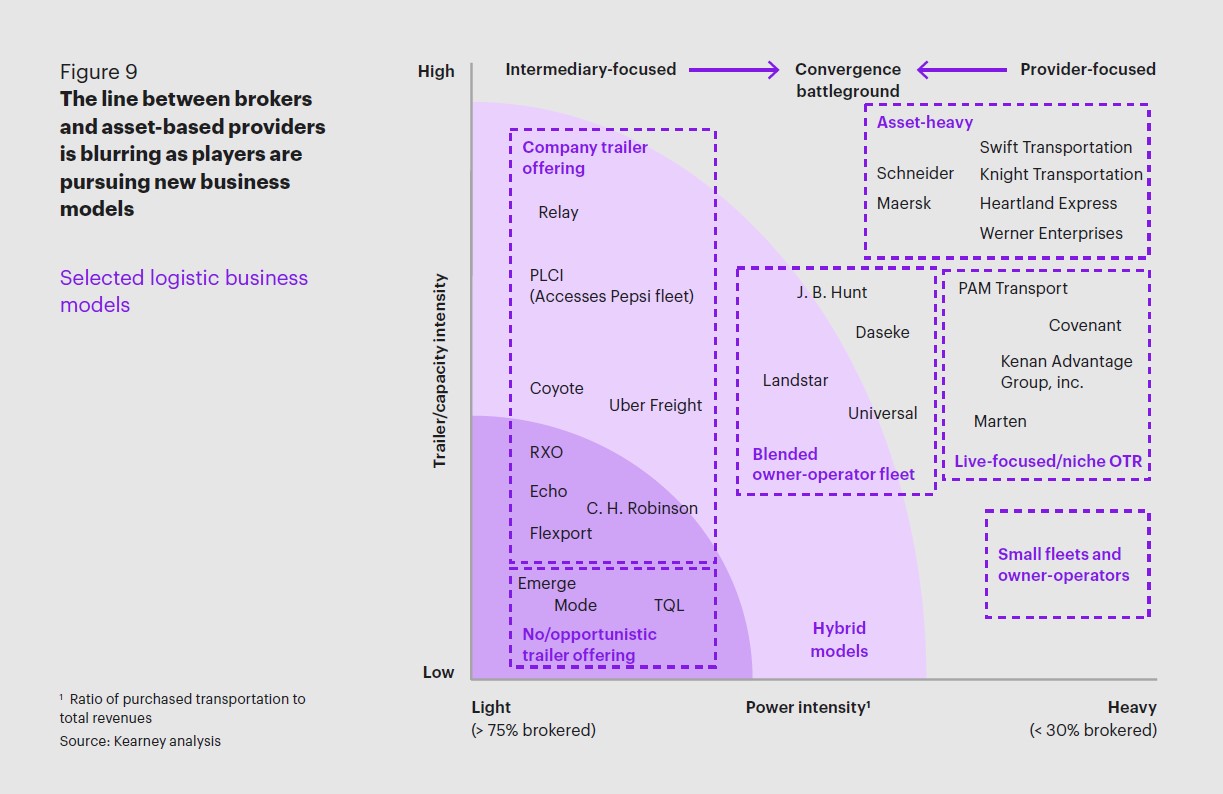
I also enjoyed the discussion of trends in the 3PL sector. The analysts pointed to a move by a number of firms into more asset-heavy logistics. In the 3PL sector that means investing in equipment, such as chassis and containers, or in warehouse space, or occasionally in actual trucks. Figure 9 from the report shows the pattern. In the 2023 time frame, why was this happening? Is it a strategy shift by 3PLs? What’s changing to cause it?
In the press release interview, the commentators were pretty clear. Historically there have been swings from more assets to fewer assets in the 3PL world. They view this as just another cyclical trend.
I agree that it’s cyclical. But what causes the cycles? I think it’s a result of the 3PLs seeking more control over their offerings to customers. If you can’t get containers or chassis from the ocean carriers or rail carriers, you need to be able to provide them for your customers. The large disruptions of 2023, and even earlier, especially in the COVID era, made it hard to guarantee you could deliver on the services you promised as a 3PL. Owning some of the enabling resources put you in a position of more control, so you wouldn’t have to disappoint customers.
There were other responses possible of course. A 3PPL could change suppliers, say of transit services, or include new networks. But there would be no guarantee that similar problems would not occur. Owning equipment and resources such as warehouse space could add certainty to offerings that are likely to remain uncertain over the next year or so.
And one thing seems clear. Uncertainty and disruption are likely to remain parts of the logistics scene in the US and worldwide for at least the next few years. Geopolitics is driving that in ways we can’t even anticipate now.
So for a 3PL to add a few assets to reduce the risk seems like a reasonable response to the increased uncertainty in the logistics world today. I’d argue that is what’s behind the drift toward assets in the 3PL world.
Samsung Electronics of America (SEA) is a major user of container shipping. They have decided to fight back against excessive and frequently undocumented Detention and Demurrage (D&D) bills from carriers. This article spells out the claims.
Overall, Samsung thinks ocean carriers were selling door-to-door service and couldn’t deliver it. So they started billing customers to recover their costs.
The Federal Maritime Commission (FMC) has recently established rules about billing for such services, making the billing more transparent and requiring documentation for each charge. This will help shoppers, who are frequently baffled by the charges.
It’s essential to close down the practice of billing without thorough documentation. Seagate should have lots of winning arguments in these cases. There were so many temporary closures, changing windows for pickup and delivery, and other delays not caused by the shipper during the COVID era and after, that most D&D charges were probably due to slipups out of the shipper’s control, and perhaps even the carrier’s control. Carriers should not be entitled to profit from these.