Tag Archives: supply chain

AI use growing, but cost…?

This report by McKinsey, the global consulting firm, sheds some light on what’s happening in the commercial realm with AI. It’s based on an online survey taken in May and June 2026, with 1,719 participants in 97 nations, spread across a full range of regions, industries, company sizes, and functional specialties. 36% of respondents work for companies with more than $1B USD in annual revenue.

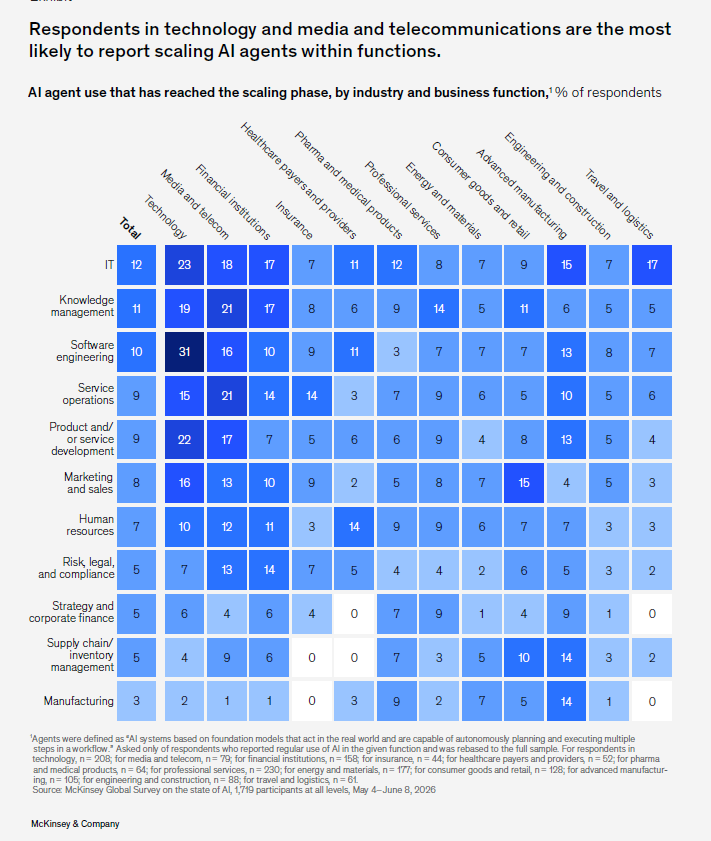
The heat map below, from the report, shows the relation of AI use that has passed beyond R&D into scaling phase by industry type and business function. The entries are the percent of respondents who say their firm is into the scaling phase. The business function rows are ranked by total percent.

What stands out?

  • How low are supply chain and manufacturing functions!! You would think there would be a lot of applications in these business functions. But, NO! Maybe it’s just because these functions are typically cost-conscious and slow to choose new technology.
  • But in advanced manufacturing, industry use in supply chains and manufacturing is close to the highest at 14%.
  • IT, knowledge management and software engineering are high. That’s what one expects when a technology such as AI emerges. We saw the same thing with the coming of the internet in the late 1990s.
  • Media is high!! What a surprise! The AI engines train on large quantities of media output. If they just operate as a grandiose search engine, they already add value of a kind we can appreciate.

One of the fascinating tidbits from the report is that chatbots are the most frequently employed form of AI. We guess that already, if we use the internet at all today. Every website seems to have one. And if my experience is any guide, they are mostly useless. They give answers to stupid questions, and can’t handle anything even slightly complicated. The most they do is have a real agent call you, and mostly they don’t do that. They direct you to someplace in the company’s sitemap, which you have probably already read without profit before desperately trying the chat.

I question whether this is the best use of all the energy and other resources consumed searching and re-searching all those tokenized training documents.

We haven’t yet seen the real cost of all these searches, over and over again, of all those training documents. It’s measured in tokens, and currently the tokens are underpriced as a loss leader to get us hooked on using AI instead of the far simpler internet search like Google. We see in daily news how many massive data centers are being built, how much resource they consume (electricity, water, grid capacity). Those costs have to be paid for in a viable business. They have no choice but to charge us for the use.

Just like internet and cell phones and cable TV, and phone service before that, we users will have to pay.

Dan Tinkoff, Lieven van der Veken, Michael Chu, and Tara Balakrishnan, August 2026

Global Seaborne Trade Hits $35 Trillion

The UN Trade and Development’s (UNCTAD) final Global Trade Update of 2025 is a very interesting report. Far from the death of international marine trade, the volume (by value) is surging 7% in 2025. That’s largely due to the increased trade between Asia and the developing world, largely in the South and Africa. US trade is distinctly off, but that’s not stopping the rest of the world from profiting by international trade.

Trade inflation increased in Q2 and Q3 2025, but is set to decrease in
Q4 2025. The graph shows overall price of traded goods: trailing four quarters and quarterly growth. The data do not include services.

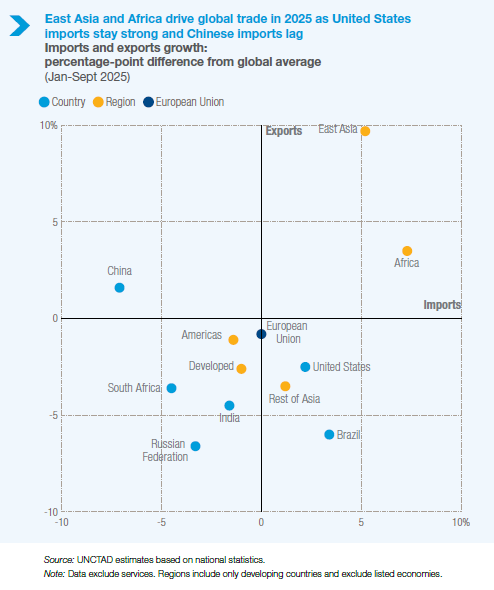
This chart shows that trade indeed has the power to drive costs down for consumers. Tariffs may have a short-term effect, but international trade finds a way to get around the restrictions. No market in the world is so big that you have to trade there. And ultimately the futility of tariffs hits home, and countries back off from imposing them. A quadrant diagram of exports and imports shows how East Asia and Africa are driving global trade now. They are the two regions showing positive percentage growth in both exports and imports through September 2025. (Again services are excluded).

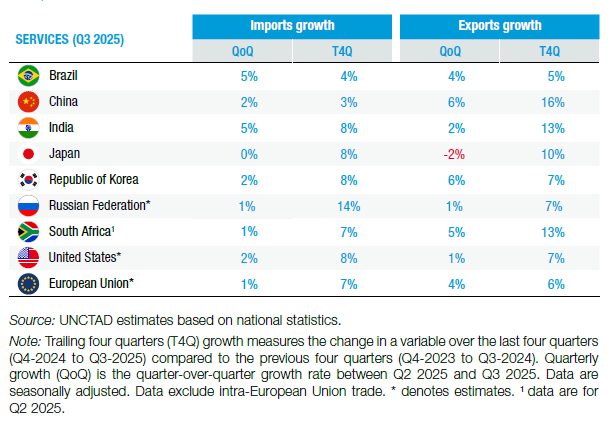
Services trade growth continued to be strong. This chart shows China, India, Japan, and South Africa led export growth by percentage, while many developed countries continued to increase major imports of services.

The whole report makes interesting reading. Kudos to the authors. It can be found here:


Mike Schuler

Total Views: 742 December 9, 2025

Ports continue march to zero-emissions

The US Ports of Los Angeles and Long Beach have reinforced their commitment to zero emissions, by signing an agreement with the South Coast Air Quality Management District. The agreement specifies concrete deadlines for moving to zero emissions.

Since around 2000, the ports here have been very concerned about cleaner air for the South Coast region of California. And there’s no question any more that people’s health in the region has suffered.

And the prolonged efforts since the Clean Air Program of a decade ago have made a significant improvement. The article states that the Clean Air Action Plan that preceded this agreement has already delivered measurable environmental gains, including 90% reductions in diesel particulate matter, 68% cuts in nitrogen oxides and 98% decreases in sulfur oxides from port-related sources since 2005.

The agreement addresses emissions from oceangoing vessels. One way is to use the Environmental Ship Index Incentive Programs. Another move is to zero emissions drayage operations. Some penalties will be introduced for violations.

Once implemented, the agreement will target emissions from cargo handling equipment, harbor craft, trucks, trains and ocean-going vessels across the ports complex.

Three cheers for organizations that keep their eye on environmental improvement despite the current negative talk.

Mike Schuler 11/11/2025

https://gcaptain.com/ports-of-los-angeles-and-long-beach-commit-to-binding-zero-emissions-agreement-with-regulators/