Here’s an example of route changes now occurring due to disruptions and freight relocation. Maersk and Hapag-Lloyd are dropping Baltimore from their TA3 transatlantic container service, and adding Philadelphia.
The new rotation is Southampton – Rotterdam – Hamburg – Wilhelmshaven – Newark – Norfolk – Philadelphia – St. John – Southampton. The new schedule kicks off with the sailing of the Maersk Fredericia from Southampton Jan. 4.
The reason offered is the handicapped service at Baltimore due to the collapse of the Francis Scott Key Bridge in 2024, when the Dali ran into an abutment, collapsing the bridge. The rebuilding will take longer than anticipated. The bridge collapse has restricted access to some berths in the port of Baltimore. That has affected throughput at the port.
The article says:
For ocean carriers, calling Baltimore adds several days’ transit time compared to Norfolk, Va., and Philadelphia. Ships have to navigate 150 miles through the Chesapeake Bay, among the longest ship channels in the world, according to a 2019 study by Texas A&M University. The route also requires the services of multiple local pilots to guide vessels in, along with a separate docking pilot at the port.
Companies have done a lot of work on supply chains in the last year to improve their resilience to geopolitical glitches. It’s been hard work to diversify suppliers to different countries to lessen risk.
But another form of risk is control of the terminals and transfer points on shipping routes. The article here notes that the port of Shanghai in China has grown at over 6% annually, even though the Chinese economy only grew at 3.5%. What’s using all that capacity? The answer is that many shipping routes still move through Shanghai even though the origin and final destination of the cargo is not in China. The routes themselves are subject to disruption if relations with China sour.
It’s also worthwhile to point out that Chinese entities control or have major financial interests in many ports round the world. If a shipper really wants to assure some independence from China, she will have to examine their shipping routes as well as the country of origin.
Is there a way to look at this connectivity? The article suggests an analysis by SKU of the port connectivity involved in the supply. A high-level indicator is provided by UNCTAD’s port connectivity index, available at this link.
Number of direct connections: The more countries can be reached through direct shipping services, i.e. without requiring a transshipment, the faster and less risky is the connection.
Number of weekly calls: The more often ships depart from a port, the lower the waiting time for the shipper.
Number of companies providing services: The more choices shippers have, the less likely they are confronted with potential negative impacts of oligopolistic or monopolistic markets (i.e. higher prices and lower service quality).
A higher number of services is an indicator of shipping options for the importer and exporter. Services may be provided jointly by various carriers, and each carrier may provide several services.
Total deployed carrying capacity: The TEU[i] that can be imported and exported to/ from a country is an indication of the total transport service supply.
Size of the largest ship: Larger container ships are more likely to be deployed in hub ports, providing additional connectivity to importers and exporters from the port thanks to trade between third countries. Also, ports that can accommodate larger ships tend to have better port infrastructure and port services.
The connectivity index is only a rough tool at best for supply chain planners and logistics pros. One needs to investigate the individual routings used for SKUs, and that requires close cooperation and openness with carriers and any third-party firms you use for logistics management.
Furthermore the routing may change even though the carriers involved are the same. So it’s daily attention rather than autopilot. Perhaps this is a job for AI agents. Almost daily checks may need to be made.
Then, what do you do about it? Do you have the power to force a change? Do you want to pay for the change? These are not easy decisions, but they certainly require attention at operational, tactical and strategic levels.
I would not be surprised to see the emergence of startups that can provide dynamic routing visibility and costing, perhaps with AI agents. Such tools can help in the current world scenario. They are most relevant in the fast-changing world political scenario we are in today. That churn is creating costs for supply chains we couldn’t even imagine two years ago.
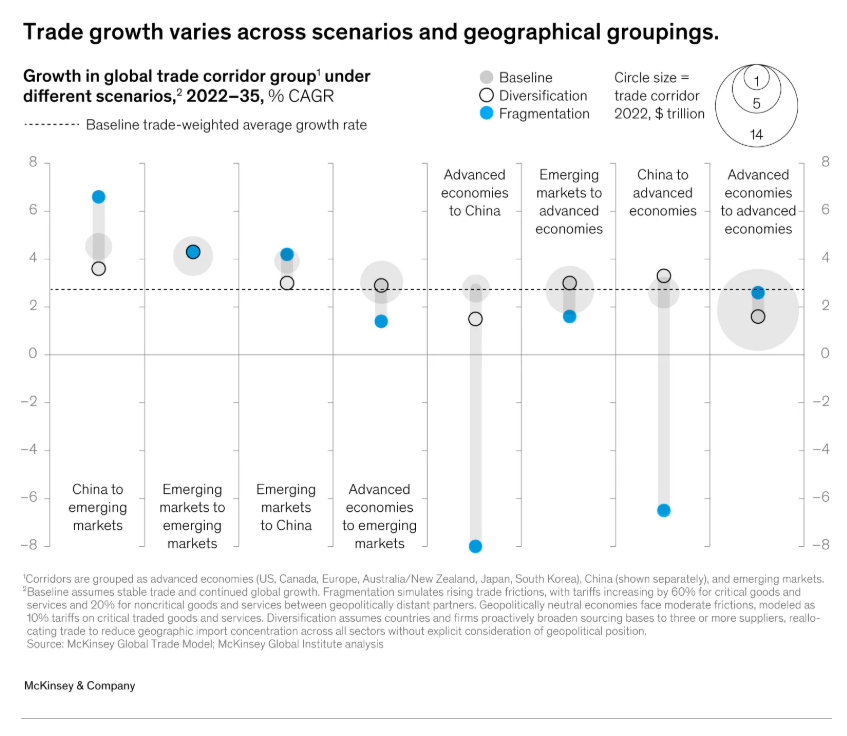
Some scenarios around the trade lanes are presented by McKinsey. The following graph shows some basic geographical groupings and three scenarios of activity, called Baseline, Diversification, and Fragmentation (the worst), over the period 2022-2035. Compound annual growth rates could range from +6% (China to emerging markets) to -8% (advanced economies to China). The source here is this web page. Such large adjustments over a long period means there’s a risk of stranding investments in infrastructure, including ports.
The people of the world will be much better served by open trade rather than fragmentation.