Tag Archives: China shipping

Panama Flag tonnage slips

Geopolitics is playing a role in selection of flag states. That includes both US pressure for supply chain control by nations in the Americas against China, and reactions by China. But Panama also wants to cultivate a pristine image as a flag state that supports and enforces international rules.

According to the most recent Clarkson’s Research data, Marshall Islands now ranks ahead of Panama in fleet tonnage registered. Liberia remains first.

Panama’s drop has two causes.

First, Panama has been actively removing shadow fleet and older tonnage from their registry. These are usually ships that run a risk of maintenance problems. Panama now limits tankers and bulkers older than 15 years. This is a sign that Panama wants to be known as a trusted registry, safety-conscious and willing to enforce maritime safety and management rules.

Panama stands out for the age of its fleet. Its average ship is 19.5 years old, the oldest among the top five flags. Liberia averages 12.6 years, the Marshall Islands 12, Singapore 11.3 and Hong Kong 14.9.

Second, Panama and China are crossing swords over the Panama government’s seizure of the CK Hutchison port terminals at each end of the Panama Canal.

This comes after the Hong Kong-based terminal operator, went through a phase of trying to sell the terminals. The original consortium was led by US investment firm BlackRock. However, no agreement could be reached, and the government of China said they would prevent the acquisition.

This seems to be reasonable evidence that China was indeed counting on geopolitical leverage from governance of the two ports.

Accordingly, Panama’s government went to its courts, and Panama’s highest court found that the port management contracts were illegal, and CK Hutchison would be displaced as the terminal operator. Panama is currently bidding the port management contracts and has placed temporary operators in control at the two ports.

Some think that the Panama government was encouraged or asked by the US to get rid of the Chinese influence at its ports, and the seizure by the high court was the result.

Fallout from this seizure has been action by China against Panama-flagged ships at Chinese ports. Chinese leasing companies have subsequently required some owners to reflag away from Panama when arranging newbuilding finance. Heightened Chinese scrutiny of Panama-flagged ships followed Panama’s removal of CK Hutchison-linked operators.

Some shipowners are switching to another flag to be able to access Chinese ports. This could certainly cause a decline in registered tonnage.

Graphs below, courtesy of Splash 24/7, show sizes of the top 10 and top 5 flag states.
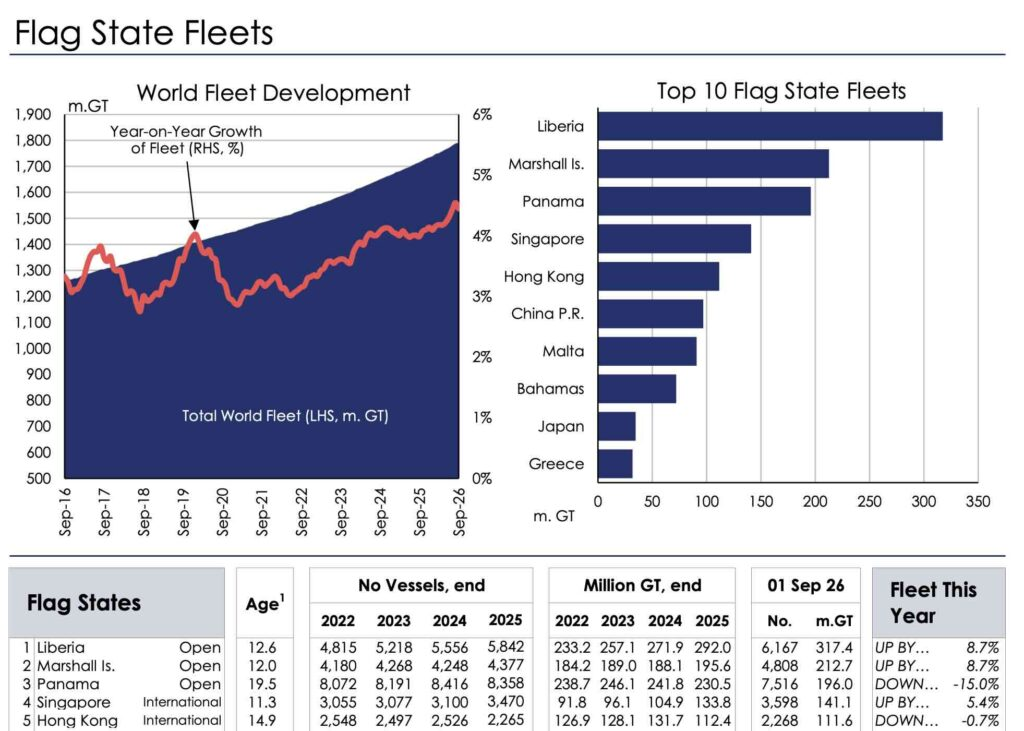
A graph illustrating the development of the world fleet, highlighting year-on-year growth percentages, alongside a bar chart showcasing the top 10 flag state fleets by size in million gross tons (m. GT) for September 2026.

Source: Clarksons Research, via Splash 24/7

Logo of Splash247.com featuring the word 'Splash' in bold black font with a blue underline, followed by '.com'.

Sam Chambers September 25, 2026

https://splash247.com/panama-slips-to-third-in-global-flag-rankings/
Resilience blind spot in shipment routing

Companies have done a lot of work on supply chains in the last year to improve their resilience to geopolitical glitches. It’s been hard work to diversify suppliers to different countries to lessen risk.

But another form of risk is control of the terminals and transfer points on shipping routes. The article here notes that the port of Shanghai in China has grown at over 6% annually, even though the Chinese economy only grew at 3.5%. What’s using all that capacity? The answer is that many shipping routes still move through Shanghai even though the origin and final destination of the cargo is not in China. The routes themselves are subject to disruption if relations with China sour.

It’s also worthwhile to point out that Chinese entities control or have major financial interests in many ports round the world. If a shipper really wants to assure some independence from China, she will have to examine their shipping routes as well as the country of origin.

Is there a way to look at this connectivity? The article suggests an analysis by SKU of the port connectivity involved in the supply. A high-level indicator is provided by UNCTAD’s port connectivity index, available at this link.

To see how the index works, read this: https://unctad.org/news/new-context-calls-changing-how-we-measure-maritime-connectivity The six major components are given here:

  1. Number of direct connections: The more countries can be reached through direct shipping services, i.e. without requiring a transshipment, the faster and less risky is the connection.
  2. Number of weekly calls: The more often ships depart from a port, the lower the waiting time for the shipper.
  3. Number of companies providing services: The more choices shippers have, the less likely they are confronted with potential negative impacts of oligopolistic or monopolistic markets (i.e. higher prices and lower service quality).
  4. A higher number of services is an indicator of shipping options for the importer and exporter. Services may be provided jointly by various carriers, and each carrier may provide several services.
  5. Total deployed carrying capacity: The TEU[i] that can be imported and exported to/ from a country is an indication of the total transport service supply.
  6. Size of the largest ship: Larger container ships are more likely to be deployed in hub ports, providing additional connectivity to importers and exporters from the port thanks to trade between third countries. Also, ports that can accommodate larger ships tend to have better port infrastructure and port services.

The connectivity index is only a rough tool at best for supply chain planners and logistics pros. One needs to investigate the individual routings used for SKUs, and that requires close cooperation and openness with carriers and any third-party firms you use for logistics management.

Furthermore the routing may change even though the carriers involved are the same. So it’s daily attention rather than autopilot. Perhaps this is a job for AI agents. Almost daily checks may need to be made.

Then, what do you do about it? Do you have the power to force a change? Do you want to pay for the change? These are not easy decisions, but they certainly require attention at operational, tactical and strategic levels.

I would not be surprised to see the emergence of startups that can provide dynamic routing visibility and costing, perhaps with AI agents. Such tools can help in the current world scenario. They are most relevant in the fast-changing world political scenario we are in today. That churn is creating costs for supply chains we couldn’t even imagine two years ago.

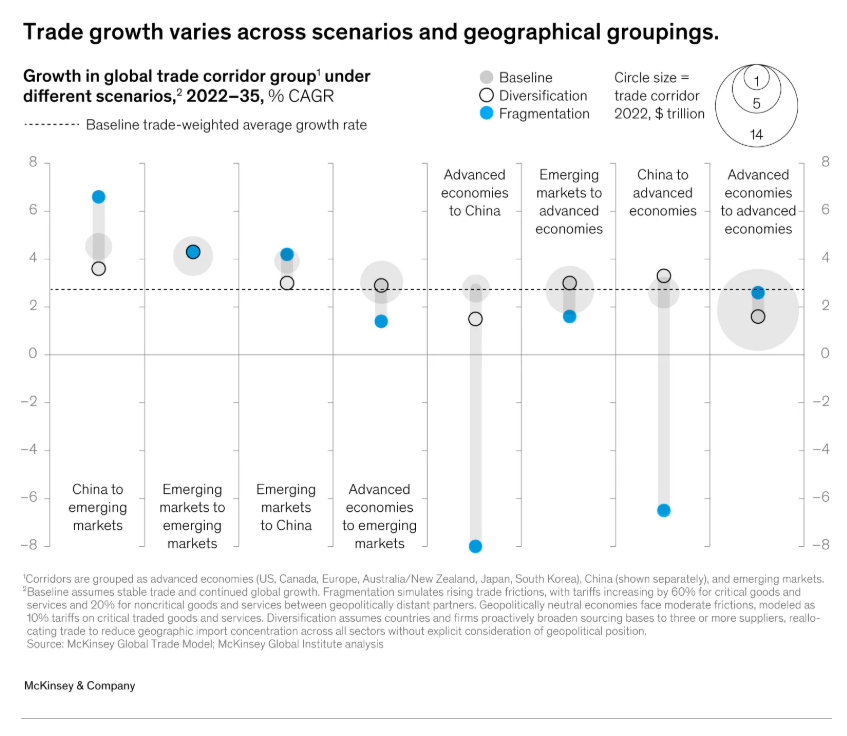
Some scenarios around the trade lanes are presented by McKinsey. The following graph shows some basic geographical groupings and three scenarios of activity, called Baseline, Diversification, and Fragmentation (the worst), over the period 2022-2035. Compound annual growth rates could range from +6% (China to emerging markets) to -8% (advanced economies to China). The source here is this web page. Such large adjustments over a long period means there’s a risk of stranding investments in infrastructure, including ports.

The people of the world will be much better served by open trade rather than fragmentation.

Splash December 15, 2025

https://splash247.com/shanghais-box-boom-exposes-a-resilience-blind-spot/