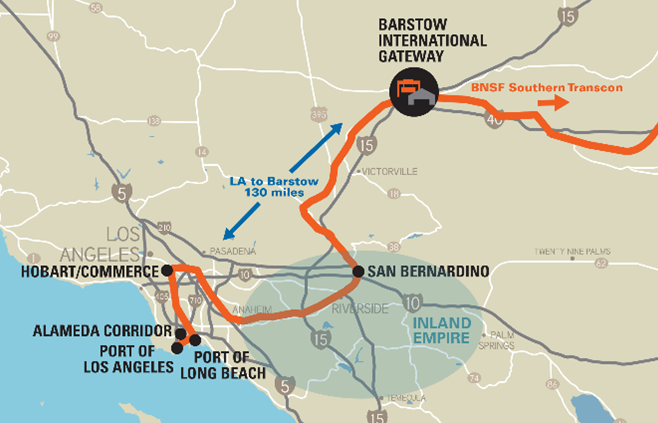
Coos Bay, OR, USA is pushing for a new West Coast US container port. It will have rail to the port, so that transloading can take place directly to it.
The port planners see a need for another West Coast port of entry for Asian containers that will reach inland via intermodal rail as far as Chicago. The Oregon International Port of Coos Bay has obtained a $25 million grant for pre-planning and pre-construction. The grant will be matched by $25 million from NorthPoint Development, and will be used for environmental review and preliminary engineering activities.
The map below shows why environmental concerns might be considerable. Coos Bay is a small town that’s long been a Mecca for beachgoers and people who love the coastside style of living. A friend moved there from Santa Rosa, in the Bay Area, for that reason.
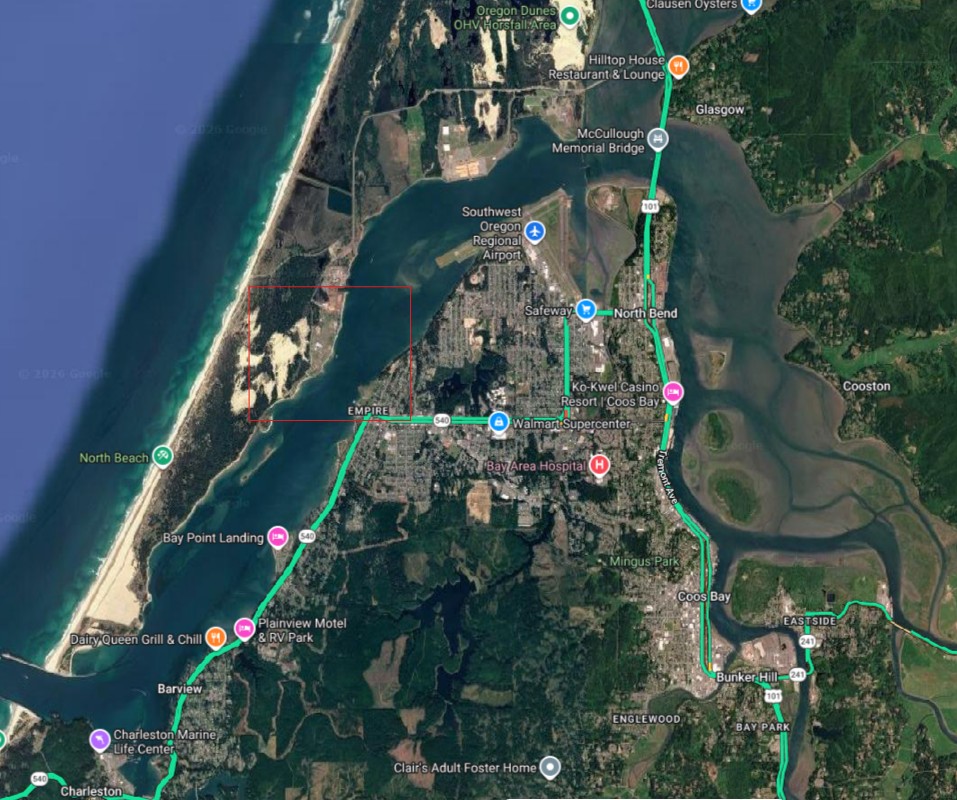
Google Map of Coos Bay, OR. Red square shows the approximate location of the new container port.
You can see on the map that ingress is through a small strait, with a narrow bay running northward to the Coos River. The port will be on the barrier island, just below another industrial site, a sawmill, according to the planning material. Its projected capacity will be 2 million TEU, or one million forty-foot containers per year.
That’s quite a few. It’ s only a bit smaller than the Port of Oakland, in CA, which runs about 2.5 million TEU per year. And it dwarfs the container traffic at the Port of Portland. However, Portland specializes more in automobiles, and grain and minerals bulk. If the port runs at 60% capacity, a reasonable figure for international container ports, that would be 1.2 million TEU per year, or 500,000 forty-foot units.
It’s not a bad idea, geopolitically, to have another West Coast port for containers. It’s a relief valve for the big California ports, which are subject to periodic longshore union strikes and other potential disruptions. Those ports are also major sources of pollution.
The all-rail connection should also make air pollution less of a problem. Perhaps the port can prevent local drayage from causing mammoth traffic and air problems in this pristine area.
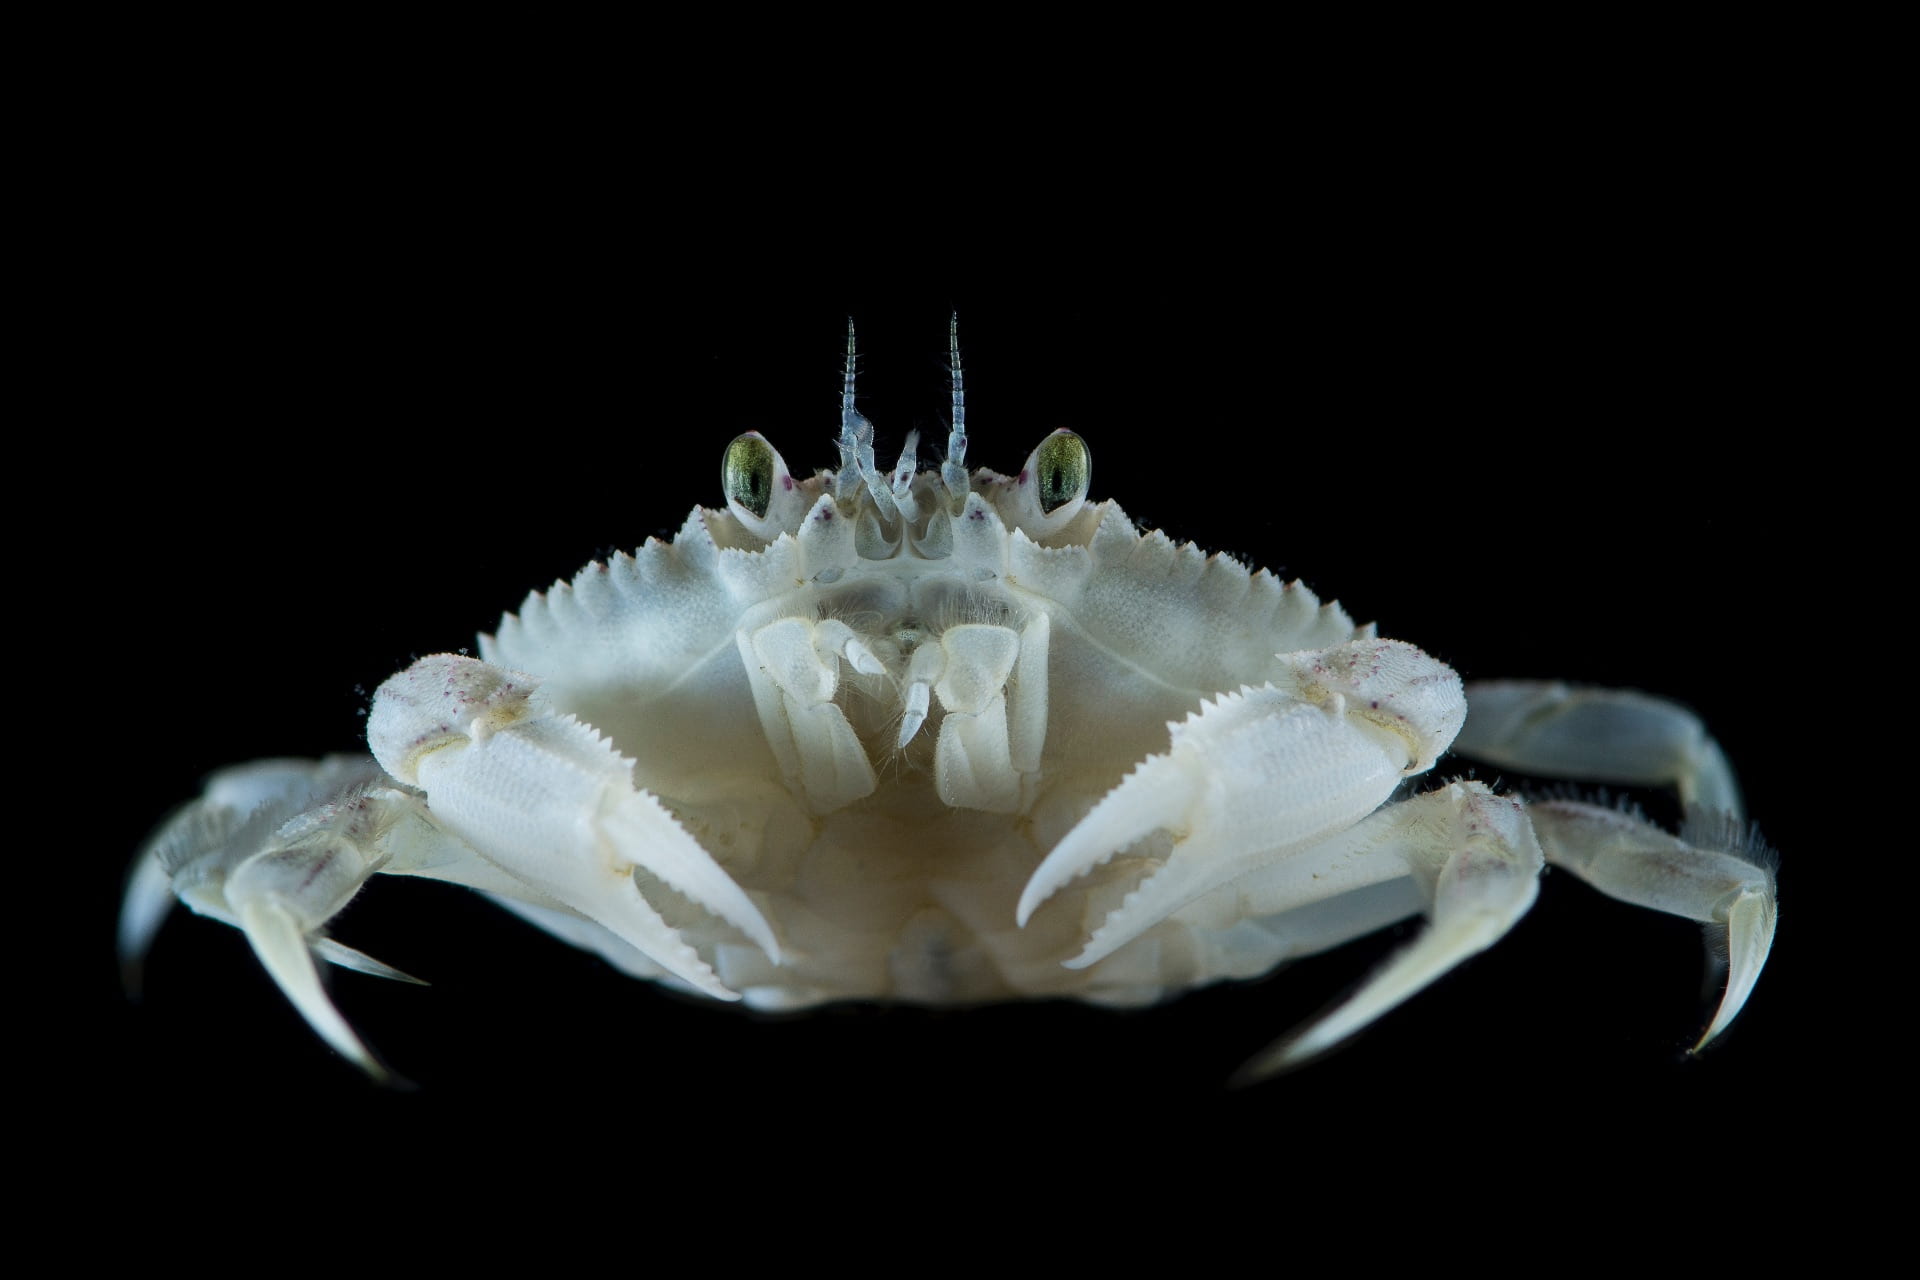
Notice Charleston Marine Life Center at the entrance to the strait, a branch of the University of Oregon. Below is a photo of a Dungeness Crab, a local resident; delicious and protected from overfishing. Dredging, which the plan says is necessary, may threaten marine species nearby.
Boxes will move via a short line, Coos Bay Rail Line, owned by the port. It runs north from the peninsula about 137 mi, terminating near Eugene OR at the Union Pacific line. That provides access by rail to all of the central US. And if the UP/NS merger comes to pass, it will provide a single transfer access even to the Northeast US and even Europe. That provides access by rail to all of the central US. And if the UP/NS merger comes to pass, it will provide a single transfer access even to the Northeast US and even Europe.
It’s not clear that more capacity is needed on the West Coast of the US, particularly if interntional maritime trade is resetting and the Asia-US container movements are declining.
Evidently East Coast container traffic is also in decline.
We see a report today of Charleston, on the US East coast, shutting down a 700,000 TEU capacity terminal, Leatherman, because of low demand. It only processed 75,455 containers so far this year. The final capacity of Leathrman Terminal when built out is planned to be 2.4 million TEU. A second berth construction project is being continued. The planned rail yard adjacent to Leatherman, a $690 million project, is being suspended.

Trains.com Staff Wednesday, June 24, 2026

Jun 25, 2026 4:59 PM by The Maritime Executive