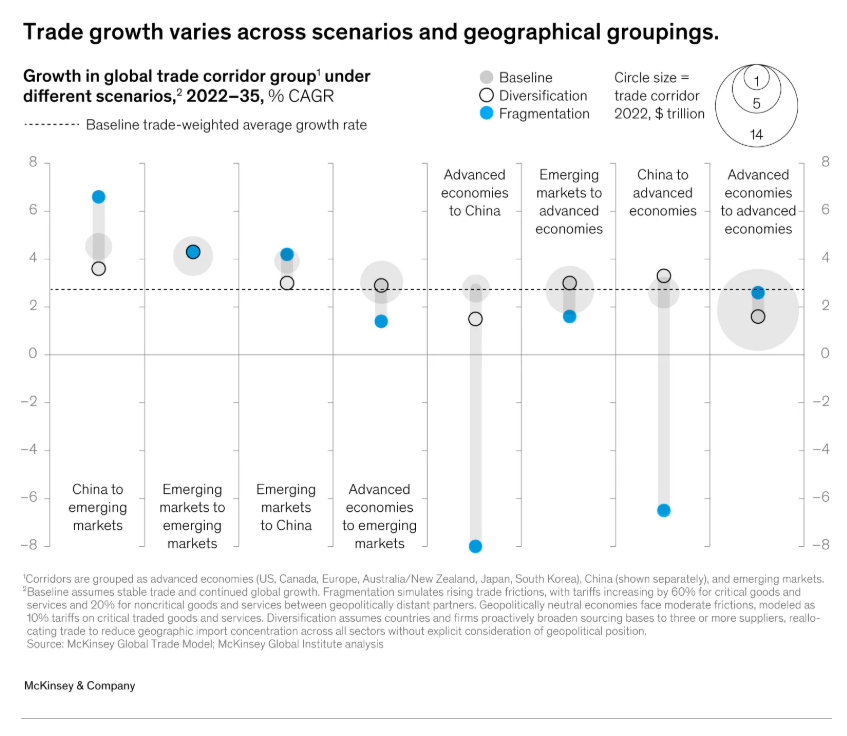
BRS is a major shipbroker headquartered in Geneva, with offices around the world. The group has issued its Annual Review 2026. One of its features is an assessment of seven major shipbuilding markets. I was interested in its take on the potential for Trump’s plan to revive American shipbuilding.
The BRS study has a very negative view. It views some ‘structural’ issues, to use economic jargon, as serious barriers. One of these barriers is the lack of sufficient labor of the kinds required in shipbuilding. Not enough engineers, not enough pipefitters, welders, and factory workers.
Not only does the US not have these workers; its recent immigration policies are preventing an influx of immigrants who might take these jobs, or allow Americans to take the jobs instead of working service jobs. The birth rate in America is also at an all-time low of 1.62; a factor of 2 is required even to replace the existing population. And surveys indicate that less than 20% of Americans want to take manufacturing jobs rather than service jobs. So where are the workers?
Another factor is manufacturing support infrastructure. Where are American shipyards going to get the supplies and sub-assemblies they need? American manufacturing has, for many years, been ‘hollowed out’ as the American economy shifted to services. Such supplies will need to come from abroad, adding to the cost and the risk. Even today, much US manufacturing is being farmed out to Mexico; closer and safer, and with more secure labor, perhaps, than China, but not nearby most American shipyard locations.
A third factor is capital. One thing the US has is an excellent capital structure, encouraging investment. But where will that capital want to flow? To the industries generating the greatest returns— artificial intelligence, healthcare, consumer services, financial services— not to hard industrial development. Pitchbook already reports something like 50% of capital for startups is going into AI and to data centers supporting AI. How will this rebuild an industrial base?
And investment capital today is facing some serious redemption issues. Investors want to get their money back with profit and are no longer willing to wait for the returns. It is taking longer to build companies. Investors, especially smaller retail investors being courted by venture capital, want their money back on schedule. That’s typically 5 or 7 years, much less time than startups need, especially in the industrial space. Even for software companies, it’s challenging.
Below, BRS summarizes in a table various countries and their performance on 10 criteria important to shipbuilding. They use a scale of 1 to 10 to evaluate each criterion. It’s enlightening.
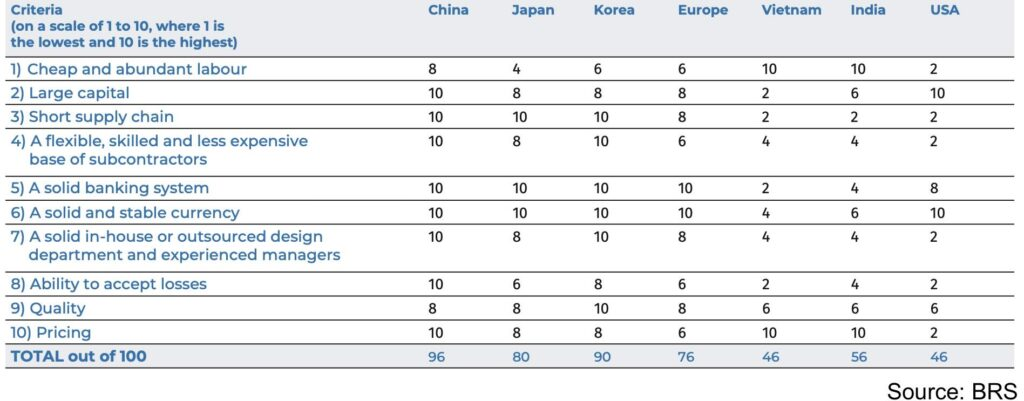
I am looking for more information from BRS on how the measurements for the countries are made.
The US has not been a major shipbuilding nation since it ran out of wood. And woodworkers. It’s not likely to come back.
The Annual Review 2026 from BRS is here. You can download it.

Sam Chambers April 1, 2026
https://splash247.com/brs-exposes-the-scale-of-the-challenge-facing-trumps-maritime-ambitions/