Green corridors are a meaningful approach to emissions reduction for shipping. They coordinate the various factors required to make emissions reductions possible. Designating a green corridor will ensure that emissions-reducing fuels will be available in sufficient quantity for the ships calling, and the infrastructure for production and delivery is there. On-shore power will also be available for ships, so they do not need to operate engines just to provide power for the ship support. And in the port, cargo handling equipment can also be designed with cleaner emissions. Properly done, drayage functions will also operate with cleaner power.
It’s great to see a new green corridor connecting China and France. The ports involved are both important stops. And we can anticipate more trade between the EU and China because of the American tariff hoopla.
There’s a lot more attention being paid to Flag States for shipping, and what kind of job they’re doing to police their members. Much of the attention is due to the abuse of flag state status by companies and owners who want to avoid being caught up in sanctions.
Sanction regimes from major powers, US, UK, EU Paris MOU, and Tokyo MOU, are getting more strict, and exposing companies to much more risk. However, if flag states don’t proactively enforce rules, they could attract ships that do not intend to play by the general international rules.
Some of these rules deal with insurance and protection for cargo owners. Some deal with care of mariners, and some with proper behavior in cargo handling, such as ship-to-ship transfers and carbon emissions in protected international spaces.
Here we highlight an example of lax enforcement turning into stricter rules. In this article, Cameroon, an African nation which operates a ship registry that has grown very fast recently, is going to purge the registry of ships that are sanctioned by the three sanctioning groups. Cameroon has also reportedly stopped new registration of ships known to be sanctioned.
Owners of those ships will need to move them to another registry. There have been frequent accidents involving ships with Cameroon registry; the average age of the fleet registered there is 32.7 years. This is much older than many operators choose to run ships.
Shipping rules are principally controlled by the International Maritime Organization (IMO) though other UN agencies play a role. In the next article, the IMO announced a campaign to combat fraud in ship registration. Fraud is a tactic often used by shadow fleet members to get around rules. These ships will claim to be registered in a flag registry when they are not. Sometimes the claimed nation does not even have a registry.
Flagging a ship in a nation’s registry makes shipboard conduct subject to that nation’s laws. Even when a ship is properly registered with a flag, there could be gaps between IMO standards, agreed to by most nations, and national laws. One prominent area is labor rules for mariners, which sometimes are violated by ships’ management.
The IMO can conduct audits of registries’ practice, and the consistency of national and international laws. It’s planning to step up those audits. This will make it harder for shadow shipping to continue practices that do not meet international shipping standards.
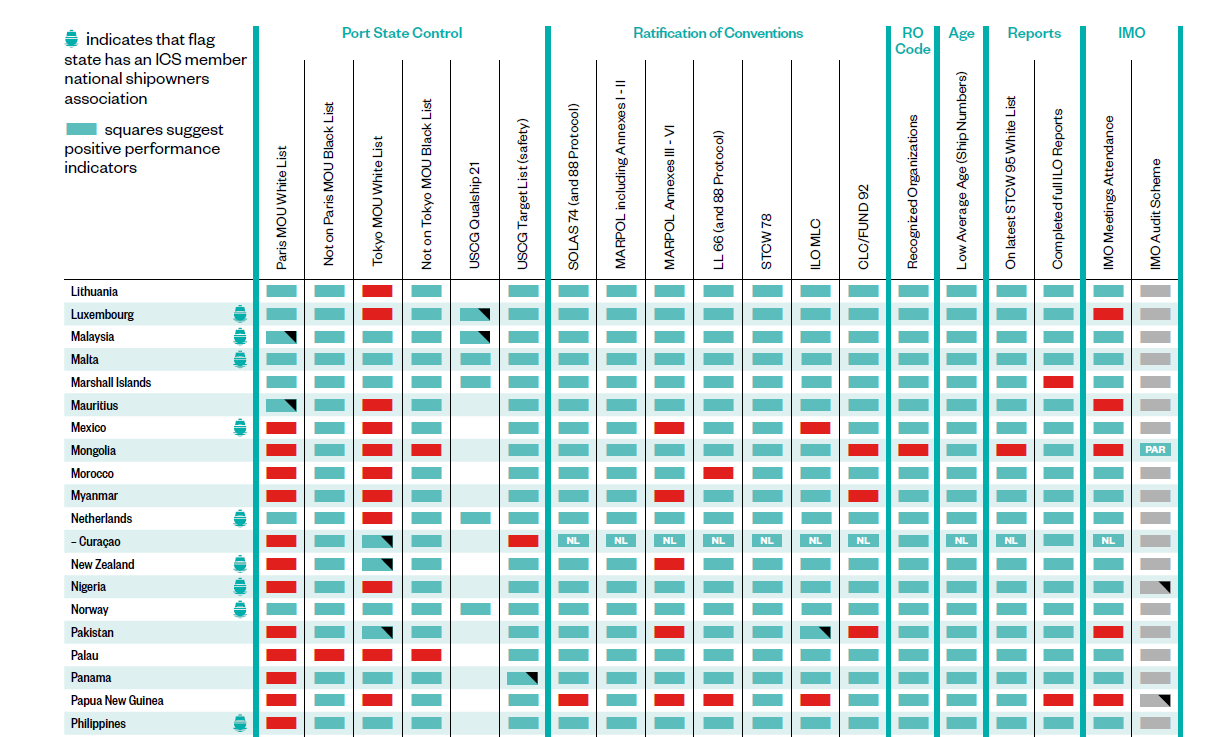
The International Chamber of Shipping (ICS) has released its latest Shipping Industry Flag State Performance Table for 2025/2026. This report is updated annually. Flag state performance is growing in importance for the shipping industry.
Rounds of sanctions are occurring often, including sanctions of registries. Some ships are changing registries or even using false registries. Shippers, brokers, and carriers need to know the status of the ships they will be using.
The report highlights the criteria used to rate the flag states. Green squares signify positive performance by a flag state. Red squares highlight potentially negative performance. Various shades of grey and some additional markings indicate what the report calls neutral indicators.
Port Shipping Control (PSC) authorities provide most of the data for the ratings. There are three principal agencies and one target list:
Paris Memorandum of Understanding (MOU) countries
Tokyo MOU countries;
United States Coast Guard (USCG) Qualship 21 program
Respective blacklists or target lists of the agencies.
To be identified via the Paris and Tokyo MOU white lists, a flag must have undergone at least one inspection in the previous three years. For the Qualship 21 program, a flag must have made at least three distinct arrivals in each of the previous three years. For the Target Lists, flags listed as ‘Medium Risk’ have a neutral indicator.
Ratification of international maritime conventions such as UNCLOS, IMO and ILO also factor in. Some states may have partially ratified or accepted these conventions, or may have legal conflicts preventing ratification. These are also considered in the ratings.
A short section of the table is displayed here:
Source: ICS Shipping Industry Flag State Performance Table 2025/2026
It’s very important to have an independent verification of the performance of flag states regarding the major maritime conventions. These ratings give interested parties information to help them follow up on the standards the ships they hire are meeting. Questions should be raised before booking passage.